Resilience
Abstract
This article explores two crucial mechanical properties of materials: resilience and toughness. Resilience represents a material's ability to absorb energy during elastic deformation and return it upon unloading, quantified through the modulus of resilience. Toughness describes a material's capacity to absorb energy in the plastic range without fracturing. The relationship between these properties and their practical applications in engineering design is examined, along with mathematical models for calculating both properties. The article presents comparative analyses of various materials and their behavior under stress, particularly relevant for applications requiring specific mechanical properties.
Introduction to Material Resilience
The ability of a material to absorb energy when deformed elastically and to return it when unloaded is called resilience. This property is typically measured by the modulus of resilience, which represents the strain energy per unit volume required to stress the material from zero stress to the yield stress. For materials used in engineering applications, understanding resilience is crucial for predicting performance under stress condition.
Measuring and Calculating Resilience
The strain energy per unit volume for uniaxial tension can be expressed as:
| (1) |
From this relationship, we can derive the modulus of resilience:
| (2) |
This equation reveals that the ideal material for resisting energy loads in applications where permanent distortion must be avoided (such as mechanical springs) should possess a high yield stress and a low modulus of elasticity.
Table 1. Modulus of resilience for various materials
| Material | E, psi | s0, psi | Modulus of resilience, Ur |
| Medium-carbon steel | 30×106 | 45000 | 33.7 |
| High-carbon spring steel | 30×106 | 140000 | 320 |
| Duraluminium | 10.5×10⁶ | 18000 | 17.0 |
| Copper | 16×106 | 4000 | 5.3 |
| Rubber | 150 | 300 | 300 |
| Acrylic polymer | 0.5×10⁶ | 2000 | 4.0 |
Understanding Material Toughness
Toughness represents a material's ability to absorb energy in the plastic range. This property is particularly valuable in components that must withstand occasional stresses above the yield stress without fracturing, such as freight-car couplings, gears, chains, and crane hooks. While toughness is a commonly referenced concept, its precise definition can be complex. One practical approach to understanding toughness is to consider it as the total area under the stress-strain curve, indicating the work per unit volume that can be applied to the material before rupture occurs.
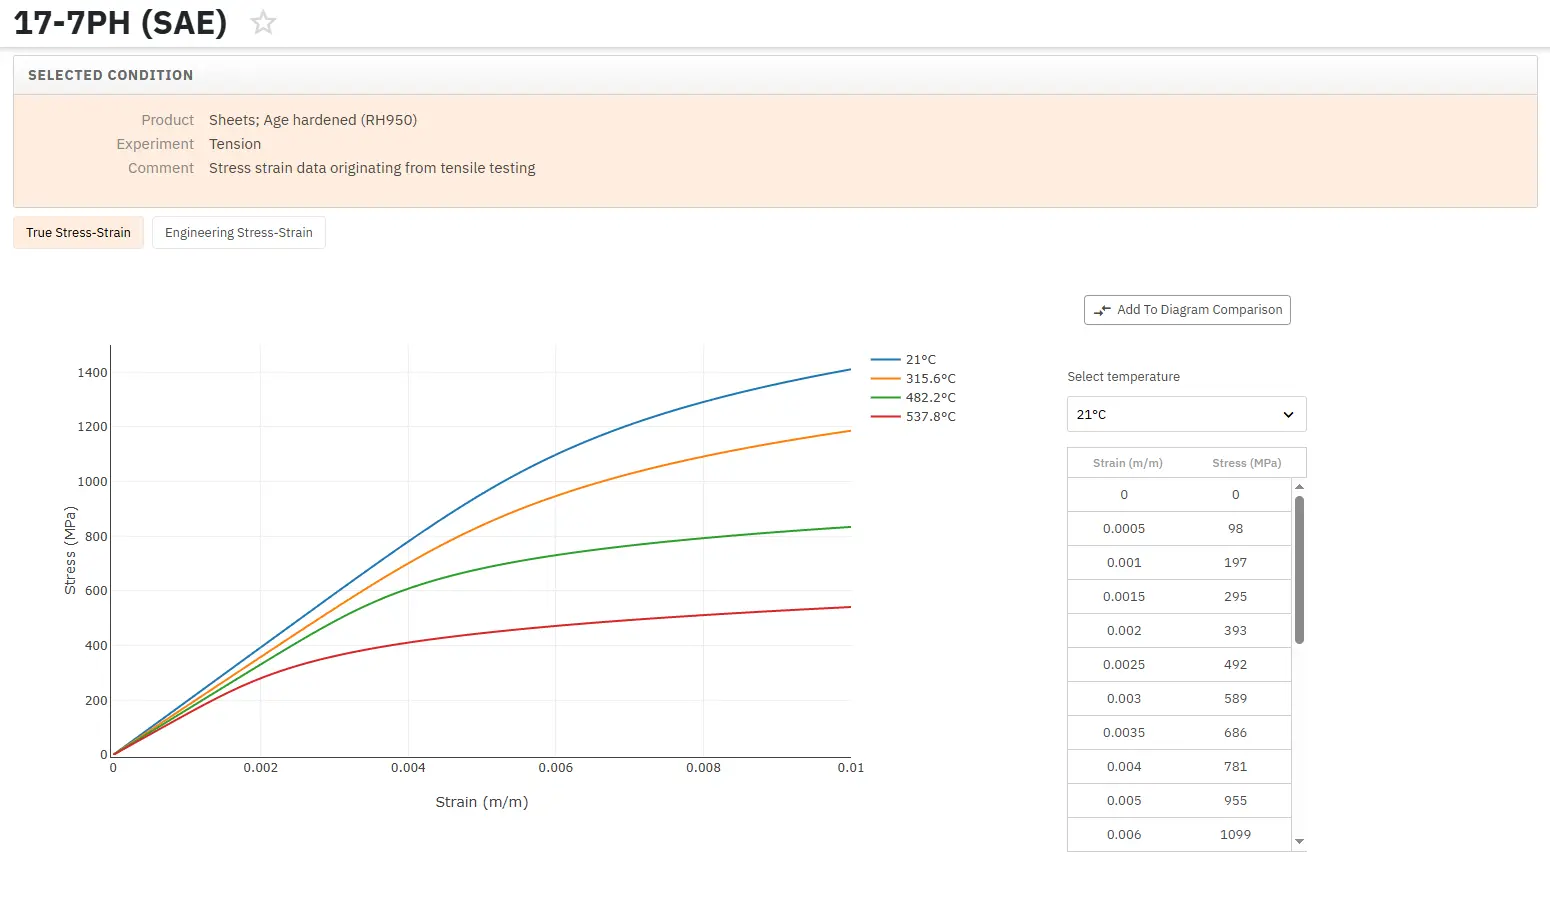
Figure 1: Comparison of stress-strain curves
The stress-strain curves shown in Figure 1 demonstrate the difference between high- and low-toughness materials. While high-carbon spring steel exhibits higher yield and tensile strength compared to medium-carbon structural steel, the structural steel's greater ductility and total elongation result in higher toughness, as evidenced by the larger area under its stress-strain curve. This illustrates that toughness is a composite parameter incorporating both strength and ductility properties.
Mathematical Approximations of Toughness
For ductile metals displaying stress-strain characteristics similar to structural steel, the area under the curve can be approximated using either of these equations:
| (3) |
| (4) |
For brittle materials, where the stress-strain curve often approximates a parabola, the area under the curve is given by:
| (5) |
It's important to note that these mathematical relationships are approximations of the area under stress-strain curves. Additionally, these curves don't represent true behavior in the plastic range, as they are based on the specimen's original area rather than the actual cross-sectional area during deformation.
Access Thousands of Stress-Strain Diagrams Now!
Total Materia Horizon includes a unique collection of stress-strain curves of metallic and nonmetallic materials. Both true and engineering stress curves are given, for various strain rates, heat treatments and working temperatures where applicable.
Get a FREE test account at Total Materia Horizon and join a community of over 500,000 users from more than 120 countries.