Thermodynamics of TiN Formation in Melts: Part Two
Abstract
In steelmaking process, a strong nitride forming element such as titanium is often added to stabilize nitrogen and improve mechanical properties of steel through the grain refinement during hot rolling.
The validity of TiN thermodynamic parameters can be examined by constructing the stability diagram of TiN for both Fe-Cr and Fe-Si melts and by observing the formation of primary and secondary TiN inclusions at controlled titanium and nitrogen contents in melt.
TiN Stability Diagram
The stability diagrams for TiN indicate the conditions under which TiN inclusions will form in melts. Using the thermodynamic parameters obtained in the many studies and the data available in literature, it is possible to construct the TiN stability diagram for both a Fe-1%Si-Ti-N melt and Fe-11%Cr-0.4%Si-Ti-N as shown in Figures 1 and 3.
In order to check the validity of the TiN stability diagram, the soluble titanium and nitrogen contents analyzed in metal samples for Fe-11%Cr-Ti-N alloy at 1873 K and 1800 K are shown as points D, E and F in Figure 1.
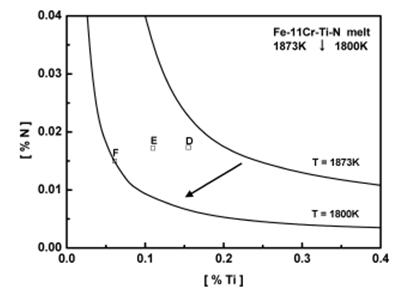
Figure 1: Stability diagram of TiN for Fe-11%Cr-Ti-N melt.
According to the stability diagram, all samples Fe-11%Cr-Ti-N melts would not form TiN inclusions at 1873 K. However, as the metal temperature decreases to 1800 K, it can be expected that TiN precipitate as secondary inclusions for samples D and E. Inclusion analysis by EPMA /Electron-Probe-Microanalysis/ for the samples could not identify any primary TiN inclusions. However, as shown in Figure 2, TEM-EDS /Transmission Electron Microscopy and Energy-Dispersive-Spectroskopy/ analysis on sample D and E identified fine secondary TiN inclusons of 0.3-0.5 μm precipitated from the melts on cooling. TiN inclusions were not observed in sample F.
The above results verify that thermodynamics parameters of chromium on titanium and nitrogen determined in the present study are valid for the thermodynamic calculation of TiN formation in Fe-Cr-Ti-N system as a function of temperature.
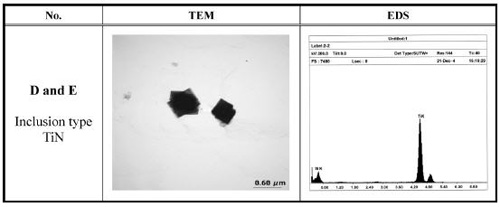
Figure 2: TEM image and EDS data of inclusions in Fe-11%Cr-Ti-N melt.
The Figure 3 shows the stability diagram for a Fe-1%Si-Ti-N melt at 1873 K.
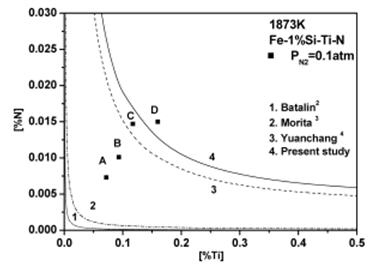
Figure 3: Stability diagram of TiN for Fe-1%Si-Ti-N melt at 1873 K.
It is apparent that there is a large discrepancy in predicting nitrogen and titanium contents for the formation of TiN in iron melt containing 1 mass% Si.
In order to resolve this discrepancy, a critical experiment was carried out to see under what conditions TiN forms in Fe-1%Si-Ti-N melt. Four Fe-1%Si-Ti samples containing different titanium contents were equilibrated with an Ar-10%N2 atmosphere at 1873 K for 12 h. Titanium nitride pellet was not added in this experiment. After the equilibration, the samples were water quenched, and analyzed for soluble titanium and nitrogen contents (points A, B, C and D in Figure 3).
According to the line 4 in Figure 2 calculated using the eSiTi value determined in many investigations, the melts with titanium and nitrogen contents of points A, B and C would not form TiN, whereas the lines 1 and 2 predict that TiN would form readily under all conditions. Inclusion analysis on metal samples by EPMA identified all inclusions in samples D as TiN precipitates as shown in Figure 4. However, inclusions in order samples (A, B and C) were identified as SiO2-TiO2 type inclusions. Figure 5 shows the SEM /Scanning Electron Microscope/ image of TiN precipitates in sample D.
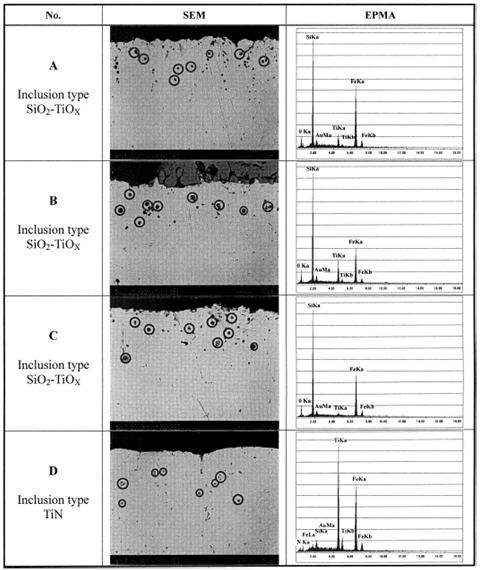
Figure 4: SEM image and EPMA analysis of inclusions in Fe-1%Si-Ti-N melt.
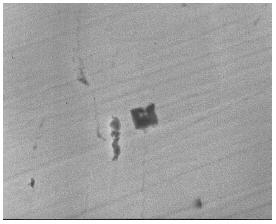
Figure 5: SEM image of TiN precipitate in sample D.
Conclusion
The validity of TiN thermodynamic parameters can be examined by constructing the stability diagram of TiN for both Fe-Cr and Fe-Si melts and by observing the formation of primary and secondary TiN inclusions at controlled titanium and nitrogen contents in melt.
Find Instantly Precise Compositions of Materials!
Total Materia Horizon contains chemical compositions of hundreds of thousands materials and substances, as well as their mechanical and physical properties and much more.
Get a FREE test account at Total Materia Horizon and join a community of over 500,000 users from more than 120 countries.