Fracture Mechanics of Cold-Drawn Copper Bars
Abstract
Crack growth occurs in most materials through intense plastic deformation possibly combined with void growth and void coalescence. The region where these processes take place is very small or of about the same size as the crack tip opening displacement.
It is difficult to study these processes experimentally and to model them analytically in any greater detail. For this reason the goal in fracture mechanics is to avoid using detailed information concerning the fracture process zone in a crack growth criterion.
Crack growth occurs in most materials through intense plastic deformation possibly combined with void growth and void coalescence. The region where these processes take place is very small or of about the same size as the crack tip opening displacement. One realizes that it is very difficult to study these processes experimentally and to model them analytically in any greater detail. For this reason the goal in fracture mechanics is to avoid using detailed information concerning the fracture process zone in a crack growth criterion.
Most important is to find one parameter which determines uniquely the state of stress and strain outside the fracture process zone say on a circle of radius ro around the crack tip, Figure 1, and which is related to external boundary conditions, i.e. load and geometry. This parameter will act as a "single parameter" boundary condition for the inner region. If we solve the boundary value problem for the inner region, Figure 1, including the fracture process zone, the state of stress and strain there will be functions of material properties and of the single parameter defining the state at r = ro. The conclusion is then that for each material this parameter uniquely describes the conditions in the fracture process zone and thus may be suitably used in a crack growth criterion. Parameters of this type are under certain conditions the stress intensity factor K and the J-integral.
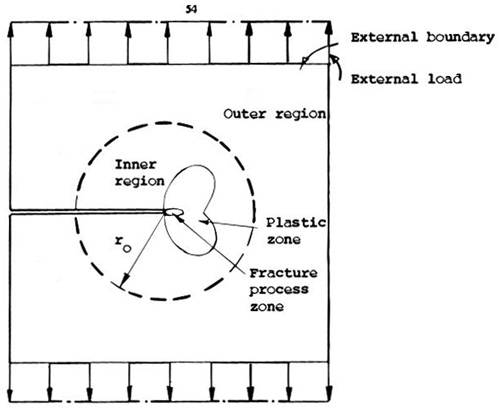
Figure 1: Boundary conditions for inner region given on circle r with intensity defined in terms of K or J
The failure of a component or a specimen with an elastic plastic material behavior proves to be much more complex than under linear elastic conditions. For the thinner specimens the formation of large plastic zones at the crack tip and crack extension by slow ductile tearing give rise to strongly non-linear load/displacement-curves.
First indications of stable crack growth have been found down to 60 % of the maximum load Fmax. The external load can obviously be increased far beyond this point until the load carrying capacity of the remaining ligament is exceeded and tearing and final catastrophic failure can progress under reducing load. For such a plateau type of behavior it is hard to detect the achievement of maximum load and the corresponding values of crack length and displacement because COD or J determination depend besides geometry and size on machine stiffness and loading rate.
Looking at the crack tip on a microscopic scale reveals even more complex details. Figure 2 summarizes some of our knowledge about the successive stages of the ductile failure process. Starting from a natural sharp defect or an artificial crack of length ao introduced in advance by fatiguing at a low ΔK-level a plastic zone is formed under increasing load F and the crack blunts through local sliding processes. This developing stretch zone, which afterwards can be measured as a definite step on the fracture surface, grows proportional to the load until a critical crack opening displacement δi is reached and a crack advance occurs ahead of the original blunted crack.
The mode of extension at the beginning and further on may be unstable or stable through cleavage or through a continuous process of nucleation, growth and coalescence of voids in the crack tip strain field. This whole process may best be described by plotting a parameter that characterizes the stress/strain-field at the crack tip (J or δ may be chosen for elastic plastic conditions and K or G for linear elastic conditions) against crack growth Δa.
In the lower load regime of crack blunting a linear relationship between J and crack growth Δa is found. But this quasi crack growth is small as compared to that due to tearing at loads near to and at maximum load. The change of slope of the resistance curve is used to define and to measure critical values of δ and J.
Although new concepts are being developed many problems still exist today to describe quantitatively the further crack growth and the final point of tearing instability. Therefore elastic-plastic fracture toughness values are derived for microscopic crack initiation mainly and the safety philosophy is based on critical values δi and Ji for the onset of stable crack growth which appear to represent true material properties.
The simultaneous registration of either the elastic compliance, electrical resistance, acoustic emission, or ultrasonic transmission of the specimen together with load and displacement may be used. The change of either one of these physical properties with crack length allows for the evaluation of critical values of load and displacement.
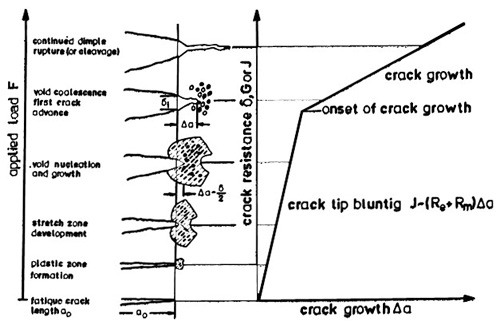
Figure 2: Successive stages of ductile failure and schematic crack resistance curve
Ductile fracture in metallic alloys usually proceeds by the four stages of:
- void nucleation by failure or interfacial decohesion of second-phase inclusions,
- void growth induced by plastic straining,
- void coalescence by strain localization in the intervoid ligament or by void impingement, and
- propagation of a macroscopic crack by accumulation of void coalescence events, sometimes along shear bands.
1. Void interaction, which promotes void growth and principally depends on the initial void volume fraction. Void interaction becomes effective mainly during the void coalescence process.
2. Strain hardening, which must be adequately introduced in void growth models or, more precisely, which must be accounted for from proper micromechanical analysis of the enlargement of a void in a strain-hardened material.
3. Void shape, which greatly influences void coalescence. It has been proven that initially spherical voids assume, in the direction of straining, a prelate ellipsoidal shape during growth under low stress triaxiality and an oblate ellipsoidal shape under high stress triaxiality. The initial void shape is imposed the inclusion shape.
4. The presence of the inclusion at which the void nucleates, which, at low stress triaxialities or in cases large shear strains, may hinder contraction of the void. When a void initiates through the fracture of second-phase inclusion, the presence of the inclusions, also affects void growth considerably.
5. Heterogeneity and anisotropy in the distribution voids, which play a key role in the onset of void coalescence or shear localization and explain importance of variations of the ductility of a material when tested in different directions.
6. Elastically driven void growth instabilities, which develop at high stress triaxialities.
7. Inhomogeneous boundary strain rate, which are en countered at crack tips, or local strain gradient, which may develop for very small voids.
8. Plastic anisotropy, which slightly influences void growth.
Most often void growth models have been assessed on ideal materials with a high content of large inclusions created by powder metallurgy. In these materials, quantitative measurements of porosity distribution are possible. However, in industrial alloys, voids frequently remain very small (<10 μm) and porosity is always very low. In steel, void size can be directly measured metallographically by unloading after some extent of straining and by breaking the strained specimen below the brittle-ductile transition temperature. This method preserves void size. In other industrial alloys, direct evaluation of void size in the bulk is less accurate.
Indeed, polishing changes void size. Indirect porosity measurements are, thus, necessary. Porosity distribution and local void dimensions must then be recovered from experimental data, which usually refer to a porosity averaged in a large volume. The determination of the real evolution of porosity distribution is important in order to physically identify the parameters of the void growth models. Prediction of void coalescence by micromechanical criteria requires quantitative modeling of the void interdistance and mutual arrangement.
Access Fracture Mechanics Properties of Thousands of Materials Now!
Total Materia Horizon includes a unique collection of fracture mechanics properties such as K1C, KC, crack growth and Paris law parameters, for thousands of metal alloys and heat treatments.
Get a FREE test account at Total Materia Horizon and join a community of over 500,000 users from more than 120 countries.