True Stress - True Strain Curve: Part Two
Abstract
This article explores the concept of true stress-strain curves in metal deformation analysis, contrasting them with conventional engineering stress-strain curves. While engineering curves are based on original specimen dimensions, true stress-strain curves account for the continuous changes in cross-sectional area during testing, providing more accurate representation of material behavior up to fracture. The article explains how metals continue to strain-harden until fracture, examines the mathematical relationships between engineering and true measurements, and discusses the significance of necking phenomena in tensile testing. Understanding these concepts is essential for accurate characterization of metal deformation properties in materials engineering applications.
Introduction to True Stress-Strain Analysis
The engineering stress-strain curve, though widely used, does not accurately represent a metal's deformation characteristics because it relies solely on the specimen's original dimensions, which change continuously during testing. When ductile metals undergo tensile testing, they become unstable and neck down during later stages of deformation. Since the cross-sectional area decreases rapidly at this stage, the load required for continued deformation decreases, resulting in the characteristic drop in the engineering stress-strain curve beyond the maximum load point.
Understanding Flow Curves in Metal Deformation
In reality, metals continue to strain-harden throughout the deformation process until fracture occurs. This means the actual stress required to produce further deformation increases continuously. When calculations use the true stress based on the actual cross-sectional area of the specimen, the resulting stress-strain curve increases continuously up to fracture. If strain measurements are also based on instantaneous measurements, the resulting curve is known as a true-stress-true-strain curve or flow curve, representing the material's fundamental plastic flow characteristics.
Any point on the flow curve can be considered the yield stress for a metal strained in tension by the corresponding amount. If the load is removed at a particular point and then reapplied, the material will behave elastically throughout the entire range of reloading.
Mathematical Relationships Between Engineering and True Stress-Strain
The true stress (σ) can be expressed in terms of engineering stress (s) by:
 (1)
(1)
It's important to note that this equation's derivation assumes both constant volume and homogeneous strain distribution along the tension specimen's gauge length. Therefore, Equation 1 should only be applied until the onset of necking. Beyond maximum load, true stress should be determined from actual measurements of load and cross-sectional area:
 (2)
(2)
Similarly, the true strain (ε) may be determined from the engineering or conventional strain (e) by:
 (3)
(3)
This equation is also applicable only until the onset of necking. Beyond maximum load, true strain should be based on actual area or diameter measurements:
 (4)
(4)
Comparing Engineering and True Stress-Strain Curves
When comparing true-stress-true-strain curves with corresponding engineering stress-strain curves, several observations can be made. Due to relatively large plastic strains, the elastic region appears compressed into the y-axis. In accordance with Equations 1 and 3, the true-stress-true-strain curve always appears to the left of the engineering curve until maximum load is reached. However, beyond maximum load, the highly localized strains in the necked region used in Equation 4 far exceed the engineering strain calculated from Equation 1.
Necking Phenomena and Fracture Behavior
The flow curve often shows linear behavior from maximum load to fracture, though in some cases its slope continuously decreases up to fracture. The formation of a necked region or mild notch introduces triaxial stresses, making it difficult to accurately determine the longitudinal tensile stress out to the fracture point. This complexity highlights the importance of using true stress-strain analysis for accurate material characterization.
Access Thousands of Stress-Strain Diagrams Now!
Total Materia Horizon includes a unique collection of stress-strain curves of metallic and nonmetallic materials. Both true and engineering stress curves are given, for various strain rates, heat treatments and working temperatures where applicable.
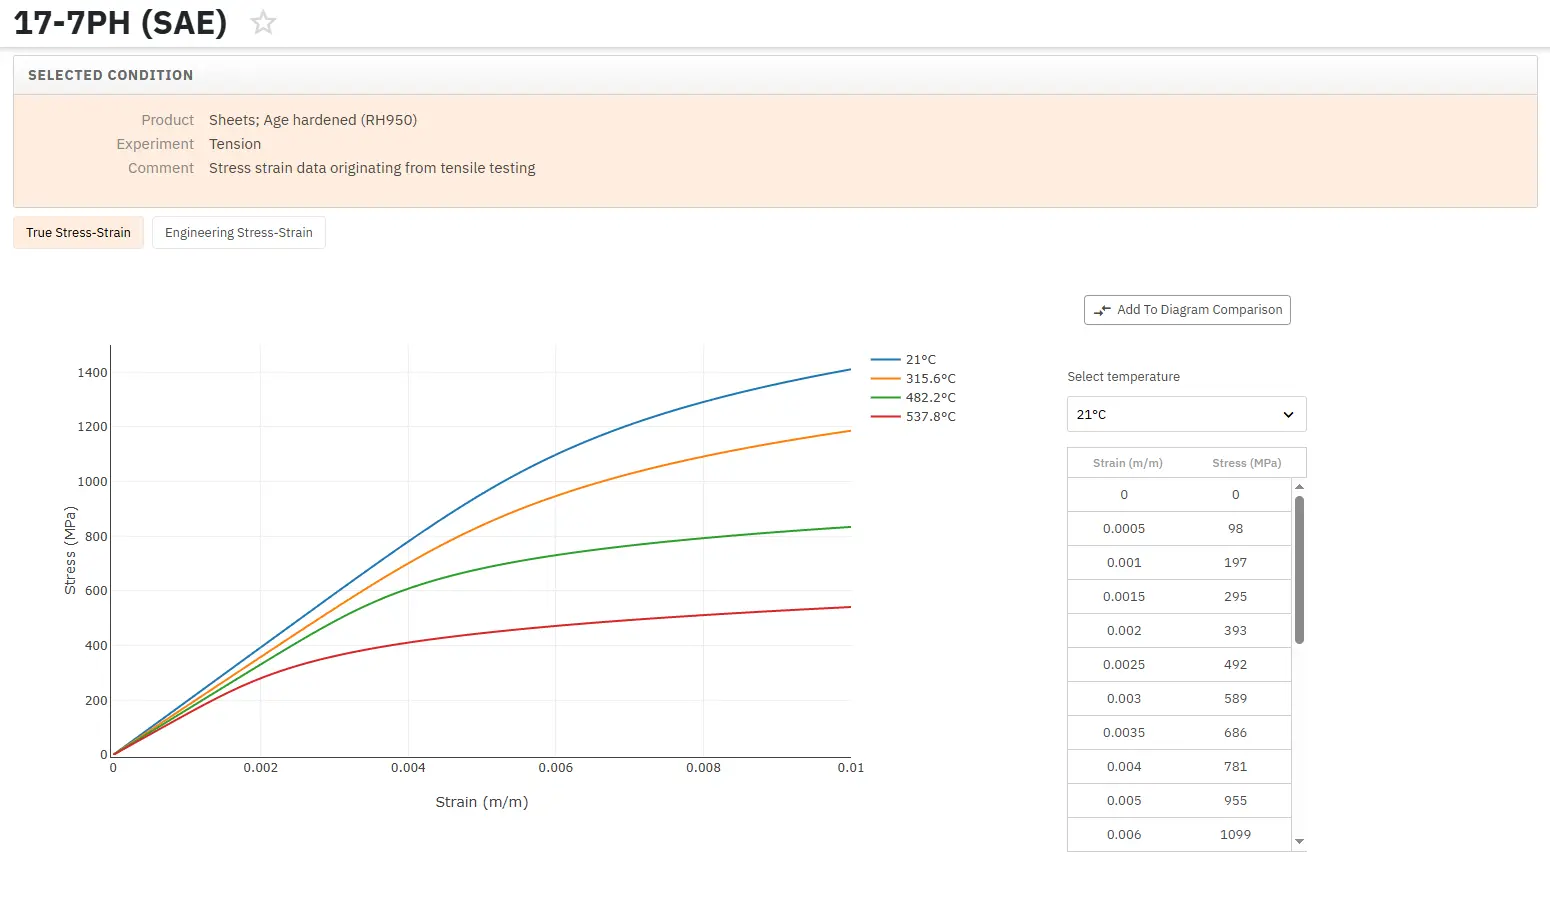
Get a FREE test account at Total Materia Horizon and join a community of over 500,000 users from more than 120 countries.