Brittle Fracture and Impact Testing: Part Two
Abstract
This article describes how NDT, FTE, FTP are used in engineering design through the fracture analysis diagram (FAD).
Temperature dependence of yield strength, tensile strength, and fracture strength is explained, as well as influence of various initial flaw sizes and the dynamic tear test (DT), as a highly versatile test both for low-strength ductile materials and high-strength low-toughness materials.
The first part of this article has introduced a number of terms dealing with brittle fracture, such as NDT, FTE, FTP, etc. The tests for determining these transition temperatures have been described. Before seeing how they are used in engineering design through the fracture analysis diagram, we redefine these transition points through reference to basic properties of the tension lest.
The subambient temperature dependence of yield strength σo (Rp0.2) and ultimate tensile strength σu in a bcc metal are shown in Fig.1.
For an unnotched specimen without flaws the material is ductile until a very low temperature, point A, where σo = σu. Point A represents the NDT temperature for a flaw-free material. The curve BCD represents the fracture strength of a specimen containing a small flaw (a < 0.1). The temperature corresponding to point C is the highest temperature at which the fracture strength σf ≈ σo. Point C represents the NDT for a specimen with a small crack or flaw.
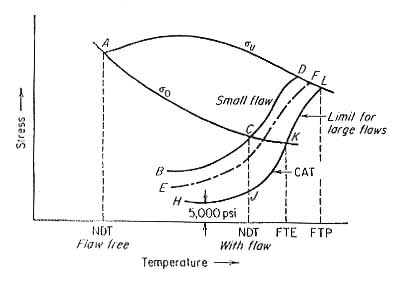
Fig.1. Temperature dependence of yield strength (σo), tensile strength (σu), and fracture strength for a steel containing flaws of different sizes
The presence of a small flaw raises the NDT of a steel by about 200°F (110°C). Increasing the flaw size decreases the fracture stress curve, as in curve EF, until with increasing flaw size a limiting curve of fracture stress HJKL is reached. Below the NDT the limiting safe stress is 5,000 to 8,000 psi (∼35 to 55 MPa).
Above the NDT the stress required for the unstable propagation of a long flaw (JKL) rises sharply with increasing temperature. This is the crack-arrest temperature curve (CAT). The CAT defines the highest temperature at which unstable crack propagation can occur at any stress level. Fracture will not occur for any point to the right of the CAT curve.
The temperature above which elastic stresses cannot propagate a crack is the fracture transition elastic (FTE). This is defined by the temperature when the CAT curve crosses the yield-strength curve (point K). The fracture transition plastic (FTP) is the temperature where the CAT curve crosses the tensile-strength curve (point L). Above this temperature the material behaves as if it is flaw-free, for any crack, no matter how large, cannot propagate as an unstable fracture.
Data obtained from the DWT and other large-scale fracture tests have been, assembled by Pellini and coworkers into a useful design procedure called the fracture analysis diagram (FAD). The NDT as determined by the DWT provides a key data point to start construction of the fracture analysis diagram. For mild steel below the NDT the CAT curve is flat.
A stress level in excess of 5,000 to 8,000 psi (35 to 55 MPa) causes brittle fracture regardless of the size of the initial flaw. Extensive correlation between the NDT and Robertson CAT tests for a variety of structural steels have shown that the CAT curve bears a fixed relationship to the NDT temperature. Thus, the NDT+30°F provides a conservative estimate of the CAT curve at stress of σo/2. NDT+60°F provides an estimate of the CAT at σ = σo, that is, the FTE and NDT+120°F provides an estimate of the FTP. Therefore, for structural steels, once the NDT has been determined, the entire scope of the CAT curve can be established well enough for engineering design.
The curve that has been traced out on Fig. 2 represents the worse possible case for large flaws in excess of 24 in.
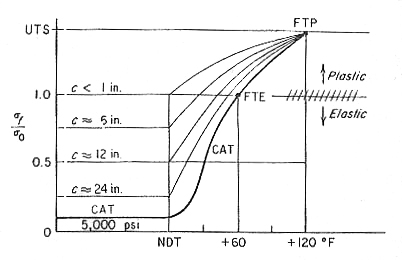
Fig.2 Fracture-analysis diagram showing influence of various initial flaw sizes.
One can envision a spectrum of curves translated upward and to the left for smaller, less severe flaws. Correlation with service failures and other tests has allowed the approximate determination of curves for a variety of initial flaw sizes. Thus, the FAD provides a generalized relationship of flaw size, stress, and temperature for low-carbon structural steels of the type used in ship construction.
The fracture analysis diagram can be used several ways in design. One simple approach would be to use the FAD to select a steel which has an FTE that is lower than the lowest expected service temperature. With this criterion the worst expected flaw would not propagate so long as the stress remained elastic.
However, this procedure may prove to be too expensive and overconservative. A slightly less conservative design against brittle fracture, but still a practical approach, would be to design on the basis of an allowable stress level not exceeding σo/2. From Fig. 2 we see that any crack will not propagate under this stress so long as the temperature is not below NDT+30°F. If for example, the service temperature is not expected to be below 10°F, we would select a steel whose NDT is 10° - 30°, that is -20°F.
The dynamic tear test (DT) can be used to construct the FAD. Below the NDT the fracture is brittle and has a flat, featureless surface devoid of tiny shear lips. At temperatures above the NDT there is a sharp rise in energy for fracture and the fracture surfaces begin to develop shear lips. The shear lips become progressively more prominent as the temperature is increased to the FTE.
Above the FTE the fracture is ductile, void coalescence-type fracture. The fracture surface is a fibrous slant fracture. The upper shelf of energy represents the FTP. The lower half of the DT energy curve traces the temperature course of the CAT curve from NDT to FTE.
The DT test is a highly versatile test because it is equally useful with low-strength ductile materials which show a high upper energy shelf and with high-strength low-toughness materials which have a low value of upper shelf energy. The large size of the DT specimen provides a high degree of triaxial constraint and results in a minimum of scatter. Extensive correlations are being developed between DT results and fracture toughness and Cv test data.
Access Fracture Mechanics Properties of Thousands of Materials Now!
Total Materia Horizon includes a unique collection of fracture mechanics properties such as K1C, KC, crack growth and Paris law parameters, for thousands of metal alloys and heat treatments.
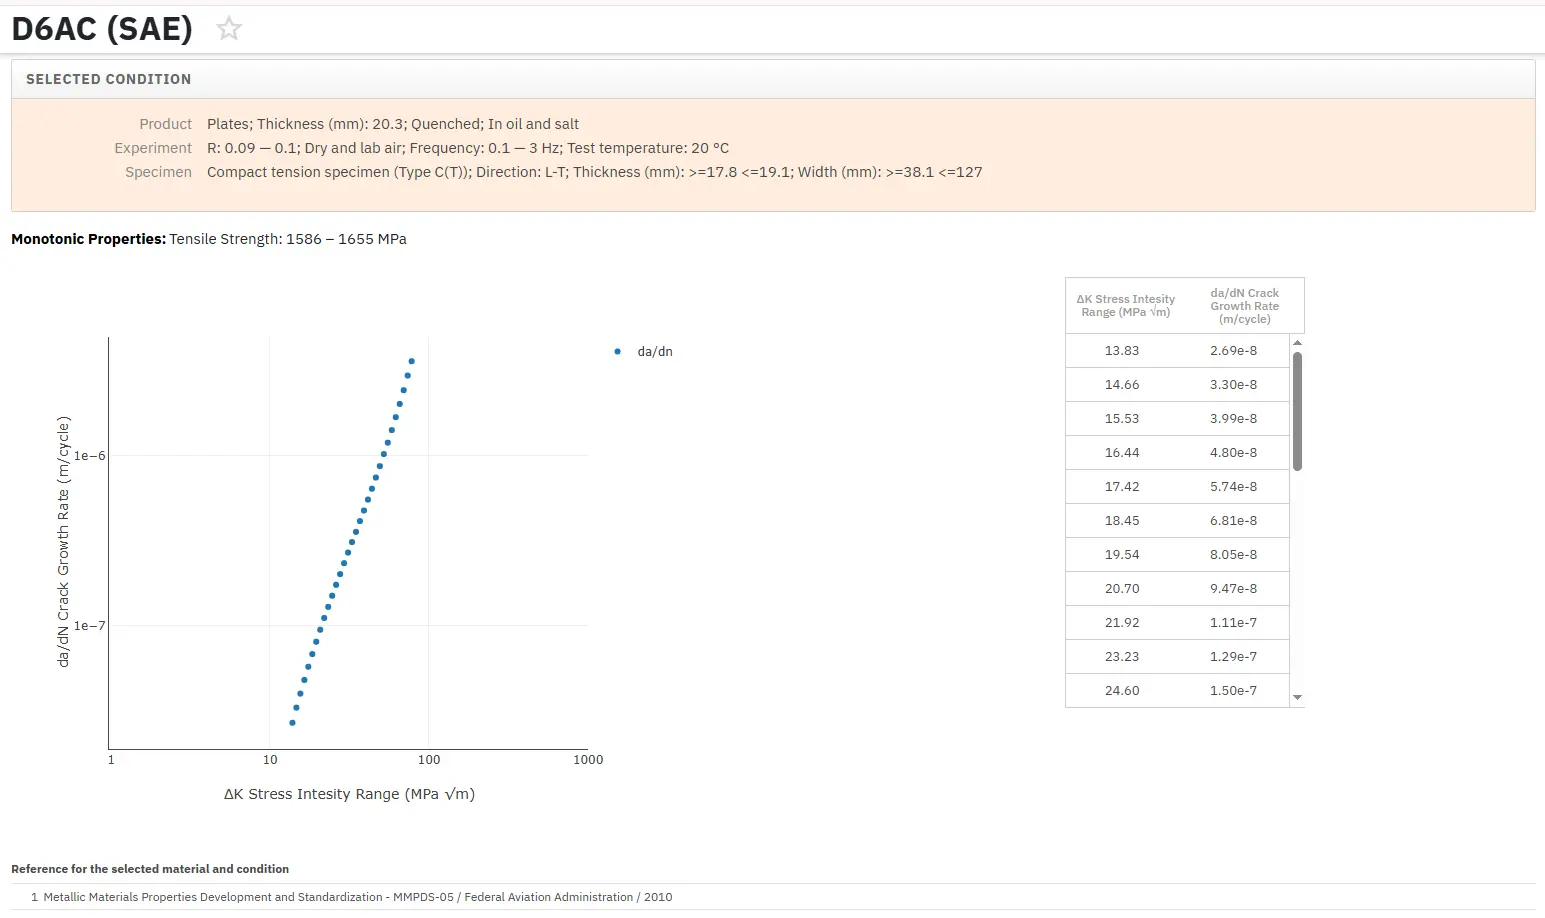
Get a FREE test account at Total Materia Horizon and join a community of over 500,000 users from more than 120 countries.