Engineering Stress-strain Curve: Part Four
Abstract
The engineering tension test is widely used to provide basic design information on the strength of materials and as an acceptance test for the specification of materials. In the tension test a specimen is subjected to a continually increasing uniaxial tensile force while simultaneous observations are made of the elongation of the specimen. The parameters, which are used to describe the stress-strain curve of a metal, are the tensile strength, yield strength or yield point, percent elongation, and reduction of area. The first two are strength parameters; the last two indicate ductility.
Measures of Yielding
The stress at which plastic deformation or yielding is observed to begin depends on the sensitivity of the strain measurements. With most materials there is a gradual transition from elastic to plastic behavior, and the point at which plastic deformation begins is hard to define with precision. Various criteria for the initiation of yielding are used depending on the sensitivity of the strain measurements and the intended use of the data.
- True elastic limit based on micro strain measurements at strains on order of 2 x 10⁻⁶ in | in. This elastic limit is a very low value and is related to the motion of a few hundred dislocations.
- Proportional limit is the highest stress at which stress is directly proportional to strain. It is obtained by observing the deviation from the straight-line portion of the stress-strain curve.
- Elastic limit is the greatest stress the material can withstand without any measurable permanent strain remaining on the complete release of load. With increasing sensitivity of strain measurement, the value of the elastic limit is decreased until at the limit it equals the true elastic limit determined from micro strain measurements. With the sensitivity of strain usually employed in engineering studies (10-4in | in), the elastic limit is greater than the proportional limit. Determination of the elastic limit requires a tedious incremental loading-unloading test procedure.
- The yield strength is the stress required to produce a small-specified amount of plastic deformation. The usual definition of this property is the offset yield strength determined by the stress corresponding to the intersection of the stress-strain curve and a line parallel to the elastic part of the curve offset by a specified strain. In the United States the offset is usually specified as a strain of 0.2 or 0.1 percent (e = 0.002 or 0.001).
(4)
A good way of looking at offset yield strength is that after a specimen has been loaded to its 0.2 percent offset yield strength and then unloaded it will be 0.2 percent longer than before the test. The offset yield strength is often referred to in Great Britain as the proof stress, where offset values are either 0.1 or 0.5 percent. The yield strength obtained by an offset method is commonly used for design and specification purposes because it avoids the practical difficulties of measuring the elastic limit or proportional limit.
Some materials have essentially no linear portion to their stress-strain curve, for example, soft copper or gray cast iron. For these materials the offset method cannot be used and the usual practice is to define the yield strength as the stress to produce some total strain, for example, e = 0.005.
Measures of Ductility
At our present degree of understanding, ductility is a qualitative, subjective property of a material. In general, measurements of ductility are of interest in three ways:
- To indicate the extent to which a metal can be deformed without fracture in metalworking operations such as rolling and extrusion.
- To indicate to the designer, in a general way, the ability of the metal to flow plastically before fracture. A high ductility indicates that the material is "forgiving" and likely to deform locally without fracture should the designer err in the stress calculation or the prediction of severe loads.
- To serve as an indicator of changes in impurity level or processing conditions. Ductility measurements may be specified to assess material quality even though no direct relationship exists between the ductility measurement and performance in service.
The conventional measures of ductility that are obtained from the tension test are the engineering strain at fracture ef (usually called the elongation) and the reduction of area at fracture q. Both of these properties are obtained after fracture by putting the specimen back together and taking measurements of Lf and Af .
 |
(5) |
| (6) |
Because an appreciable fraction of the plastic deformation will be concentrated in the necked region of the tension specimen, the value of ef will depend on the gage length L0 over which the measurement was taken. The smaller the gage length the greater will be the contribution to the overall elongation from the necked region and the higher will be the value of ef. Therefore, when reporting values of percentage elongation, the gage length L0 always should be given.
The reduction of area does not suffer from this difficulty. Reduction of area values can be converted into an equivalent zero-gage-length elongation e0. From the constancy of volume relationship for plastic deformation A*L = A0*L0, we obtain
| (7) |
This represents the elongation based on a very short gage length near the fracture.
Another way to avoid the complication from necking is to base the percentage elongation on the uniform strain out to the point at which necking begins. The uniform elongation eu correlates well with stretch-forming operations. Since the engineering stress-strain curve often is quite flat in the vicinity of necking, it may be difficult to establish the strain at maximum load without ambiguity. In this case the method suggested by Nelson and Winlock is useful.
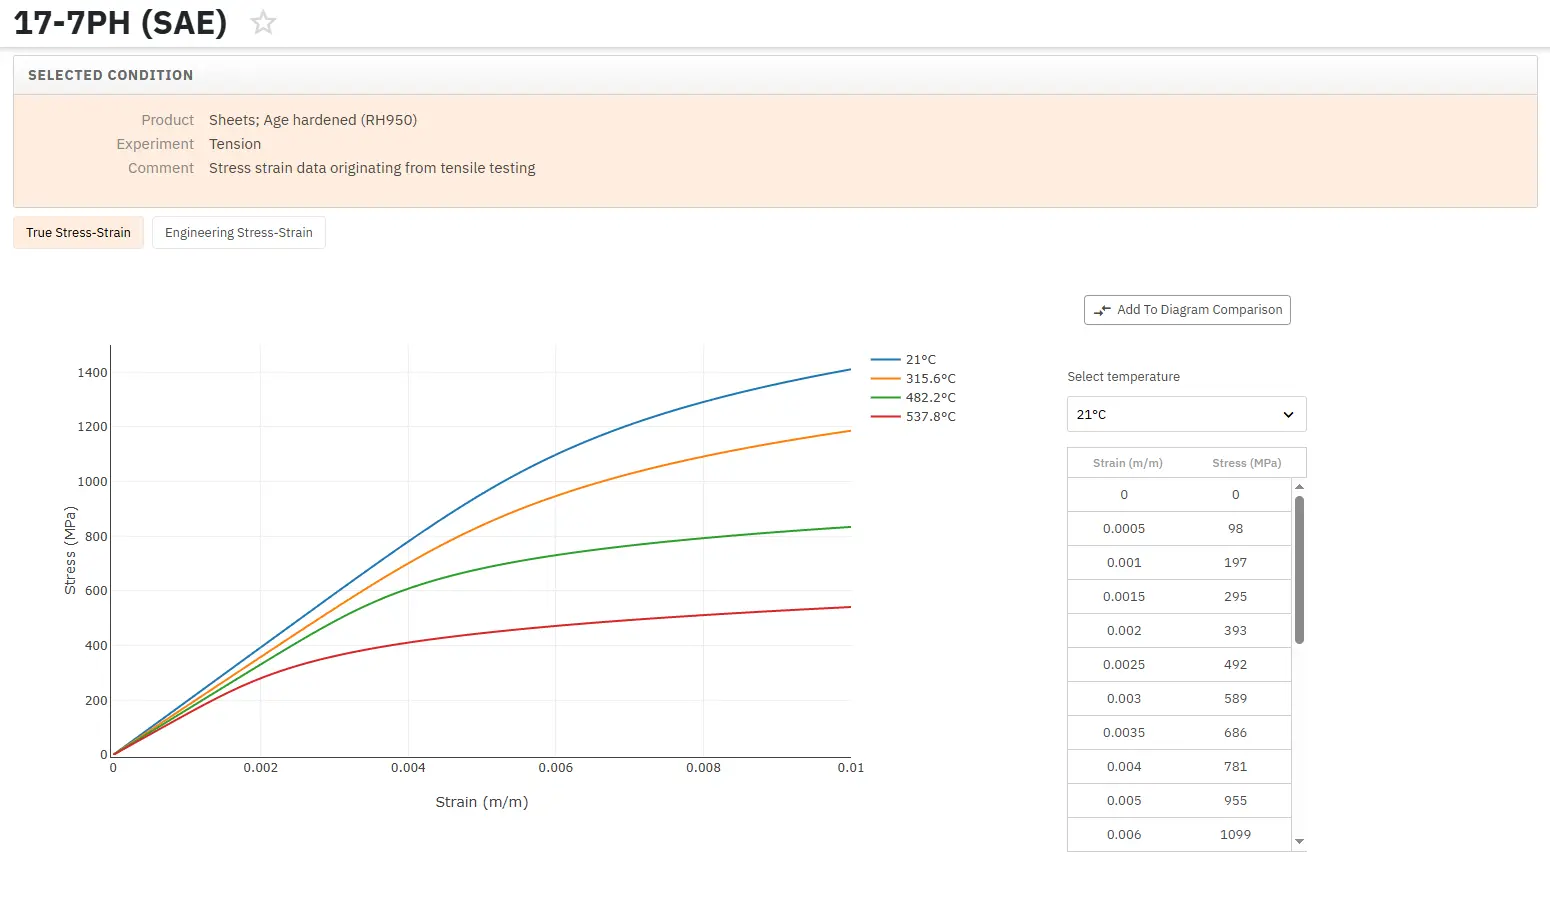
Access Thousands of Stress-Strain Diagrams Now!
Total Materia Horizon includes a unique collection of stress-strain curves of metallic and nonmetallic materials. Both true and engineering stress curves are given, for various strain rates, heat treatments and working temperatures where applicable.
Get a FREE test account at Total Materia Horizon and join a community of over 500,000 users from more than 120 countries.