Hot Torsion Testing: Part Two
Abstract
Hot torsion testing is specifically useful to assist in designing the all-important hot rolling schedules for steel.
The key areas of focus in this schedule are understanding the critical temperature phases at which recrystallization can be prevented and then the start and finish of the austenite transformation.
There are two main ways in which hot torsion testing can be used to help design the hot rolling schedules for steel:
- the determination of the three critical temperatures of hot rolling, i.e. the temperature of non-recrystallization (Tnr), and the start and finish of the austenite transformation (Ar3 and Ar1, respectively);
- the simulation of a specific (i.e.‘real’) industrial hot rolling schedule in order to assess the pass to pass evolution of the microstructure, culminating in generating the final, as-hot rolled structure.
In the many papers the microstructure evolution during hot torsion tests of stainless steels has been investigated.
Nelson reported the presence of well-developed dislocation cells in hot torsion 304L at 1100°C and considered it as evidence of the dynamic recovery (DRV) and possibly the continuous dynamic recrystallization (CDRX). On the other hand, Dehghan-Manshadi et al. investigated the effect of hot torsion processing variables such as strain, strain rate, and temperature on microstructure in 304 stainless steels under a wide range of deformation temperatures (900-1100°C) and strain rates (0.01-1s-1). They found that the dynamic recovery DDRX fraction increased with increasing shear strain.
Montheillet et al. also reported similar results. The objective of the J.Lu study was to investigate a relationship between processing variables and microstructure evolution in 304L stainless steel subjected to hot torsion. Orientation imaging microscopy (OIM) techniques were used to analyze the microstructure. Through the current study, an understanding of how processing variables correlate to microstructure evolution has been established.
2.2 Gleeble Hot Torsion Test
The Gleeble 3800 with Mobile Torsion Unit (MTU) was utilized in the study to conduct hot torsion tests of 304L stainless steel (Figure 1). In order to control the cooling rate, hot torsion samples modified by Norton, were machined and used in the current study.
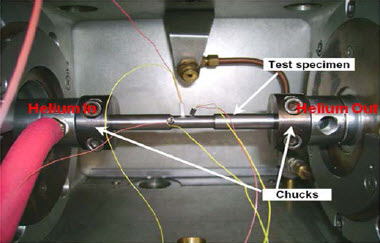
Figure 1: Modified Gleeble hot torsion device
Three thermocouples are welded to the torsion sample on the sample’s fixed side at 0mm (0”), 6.35mm (0.25”), and 12.7mm (0.5”) from the shoulder of the gauge section. The thermocouple at 12.7mm (0.5”) location was used to control the heating and cooling rates. Hot torsion tests were carried out according to the schedule illustrated in Figure 2. Under a rough vacuum, samples were resistively heated to 1100°C and rotated to a given shear strain at a given shear strain rate. After torsion, the temperature of samples deceased to 200°C at the cooling rate of roughly 9°C/s by flowing Helium cooling through the samples.
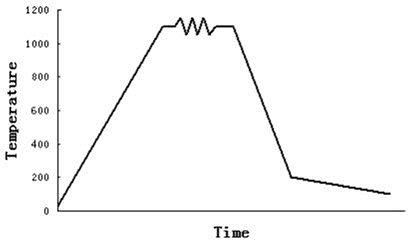
Figure 2: Schematic diagrams of hot torsion
3.1 General Characteristics
OIM results of the base metal and representative samples subjected to hot torsion are shown in Figure 3 and Figure 4, respectively. The base metal microstructure (Figure 3) consisted of equiaxed grains with a high fraction of annealing twins, which results from static recrystallization and grain growth during heat treatment. Neither dislocation structures (DSs) nor low angle boundaries (LABs) were observed.
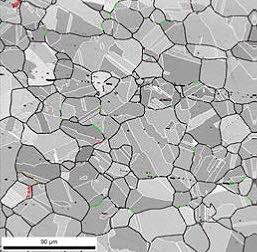
Figure 3: OIM grain map of the base metal, Red boundaries (DSs, 1-5° misorientation), Green boundaries (LABs, 5-15° misorientation), Black boundaries (grain boundaries, 15-180° misorientation), and White boundaries (twins)
The microstructure of samples subjected to hot torsion are shown in Figure 4. Compared with the base metal, CB (red boundaries, below 5° misorientation) and LAB (green boundaries, 5-15° misorientation) fractions in all samples increase. Additionally, very small grains were generated at grain boundaries or triple junctions, and bi-modal grain size distribution was observed in most samples (Figures 4a, b and d-l).
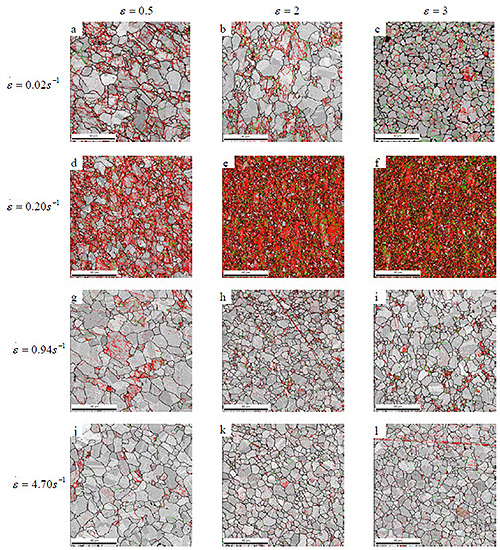
Figure 4: OIM grain map at the different shear strain rates and strains, a-c) shear strain rate: 0.02s-1 and strains: 0.5, 2 and 3, respectively; d-f) shear strain rate: 0.20s-1 and strains: 0.5, 2 and 3, respectively; g-i) shear strain rate:0.94s-1 and strains: 0.5, 2 and 3, respectively; j-l) shear strain rate: 4.70s-1 and strains: 0.5, 2 and 3, respectively; Red boundaries (DSs, 1-5° misorientation), Green boundaries (LABs, 5-15° misorientation), Black boundaries (grain boundaries, 15-180° misorientation), White boundaries (twins)
Find Instantly Thousands of Metallography Diagrams!
Total Materia Horizon contains a unique collection of metallography images across a large range of metallic alloys, countries, standards and heat treatments.
Get a FREE test account at Total Materia Horizon and join a community of over 500,000 users from more than 120 countries.