True Stress - True Strain Curve: Part Three
Abstract
This article explores the key parameters derived from true stress-strain curves in materials testing. It details the calculation and significance of various measurements including true stress at maximum load, true fracture stress and strain, true uniform strain, and true local necking strain. The content focuses on the mathematical relationships between these parameters and their practical applications in materials science and engineering, providing essential formulas and explanations for each measurement type.
Key Parameters in True Stress-Strain Analysis
The true stress-strain curve provides several critical parameters for materials analysis:
- True stress at maximum load
- True fracture stress
- True fracture strain
- True uniform strain
- True local necking strain
- Strain-hardening exponent
- Strength coefficient
True Stress at Maximum Load
The true stress at maximum load corresponds to the true tensile strength. Necking typically initiates at maximum load when the true stress equals the flow curve's slope. For a specimen with cross-sectional area Au, the true stress (σu) and true strain (εu) at maximum load relate to the ultimate tensile strength through:


Eliminating Pmax yields

 (1)
(1)
True Fracture Measurements
True Fracture Stress
True fracture stress is calculated by dividing the load at fracture by the cross-sectional area at fracture. Note: This measurement typically requires correction for the triaxial stress state present at fracture. Due to limited data availability for such corrections, reported values may contain some degree of error.
True Fracture Strain
The true fracture strain (εf) represents the maximum true strain before fracture, calculated using:
 (2)
(2)
For cylindrical specimens, the reduction of area (q) relates to true fracture strain through:
 (3)
(3)
Strain Measurements
True Uniform Strain
True uniform strain (εu) measures the strain up to maximum load, calculated using either:
- Specimen cross-sectional area (Au)
- Gage length (Lu) at maximum load
 (4)
(4)
This parameter is particularly valuable for estimating metal formability from tension test results.
True Local Necking Strain
The local necking strain (εn) measures the deformation from maximum load to fracture:
 (5)
(5)
Access Thousands of Stress-Strain Diagrams Now!
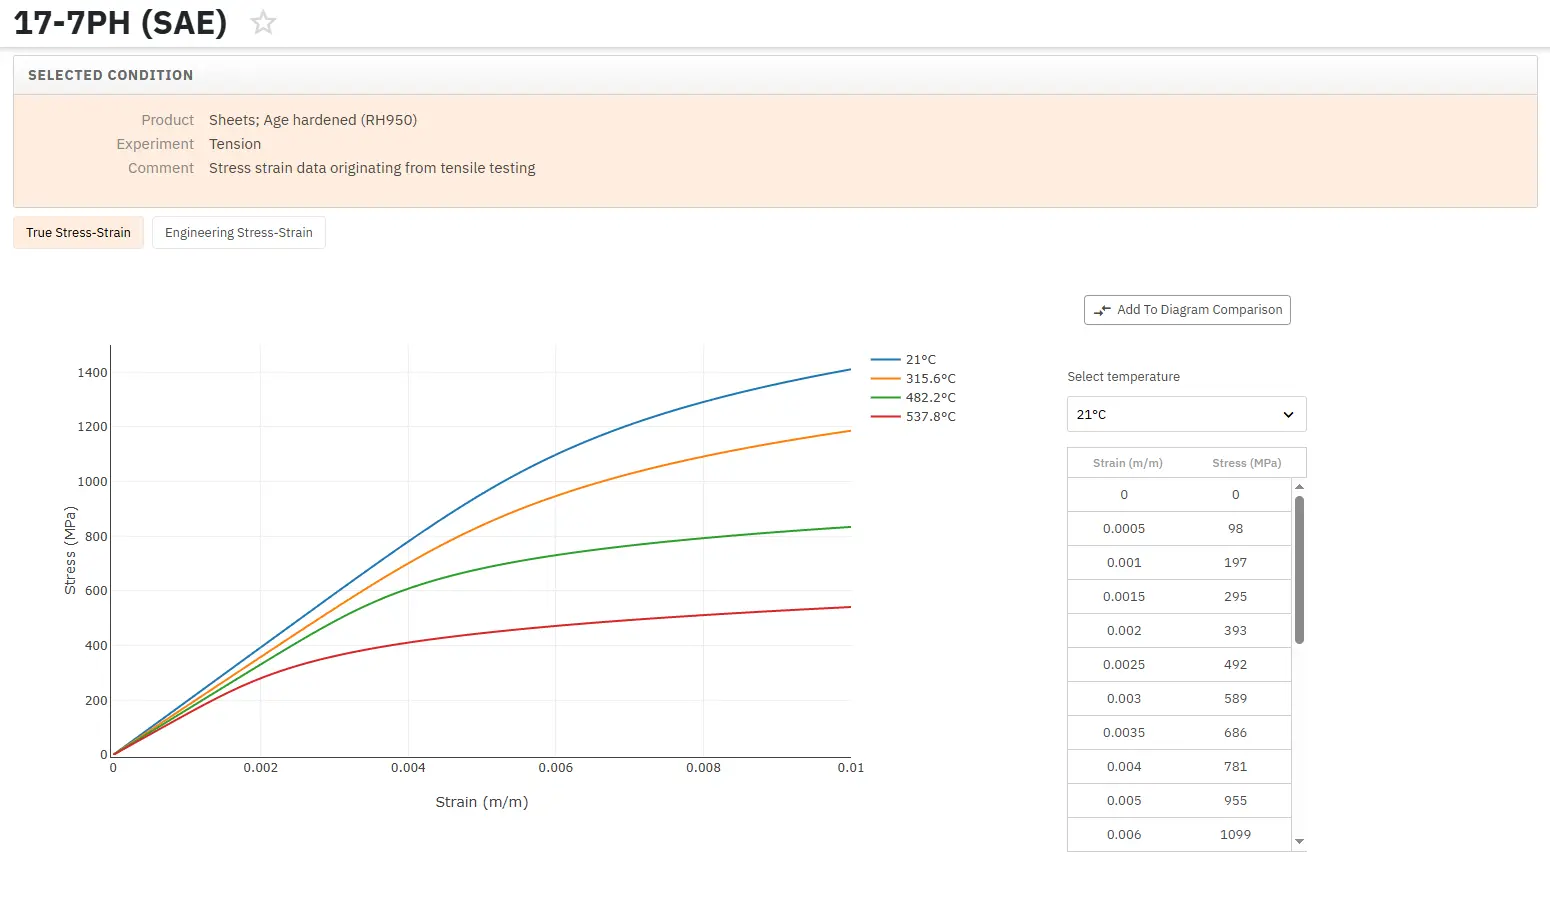
Total Materia Horizon includes a unique collection of stress-strain curves of metallic and nonmetallic materials. Both true and engineering stress curves are given, for various strain rates, heat treatments and working temperatures where applicable.
Get a FREE test account at Total Materia Horizon and join a community of over 500,000 users from more than 120 countries.