The Microforming Process: Part Two
Abstract
Micro parts are increasingly common where the requirement is to manufacture miniaturized and sometimes complex geometries in the submillimeter range.
For micro forming the “size effect” must be carefully considered as properties will change between the macro and micro states. In some cases such as flow stress this is directly related to the surface to inner grain ratio.
The application of metal forming to the manufacturing of microparts is still not widespread. One reason is that the know-how of conventional forming cannot be simply transferred to the microscale. This is due to the so called size effects, which in cold forging can be observed in terms of effects on material flow, on tribological behavior and on working accuracy.
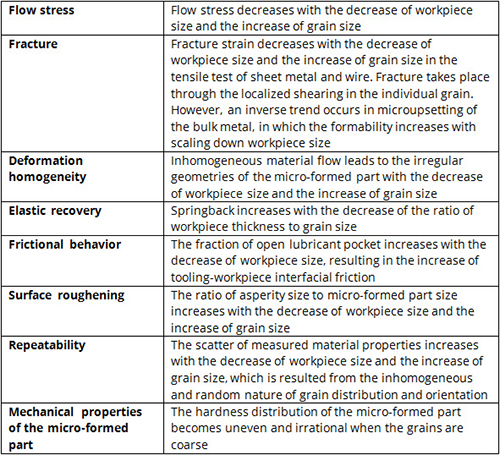
Table 1: Size effect affected deformation behaviors in microforming
The mechanism of material deformation is one of the major aspects in micro forming process, which has to be well understood in order to utilize the micro forming processes. Therefore, deformation mode of a particular material at normal scale cannot provide an indication on the behaviour of this material at micro scale. It is well recognised that the common challenges associated the normal-scaled forming processes are also experienced in micro forming, in addition to new problems which appear as a result of the miniaturized, or in another word size effects. These problems can be in general classified into four main categories related to material, process, tools and equipment.
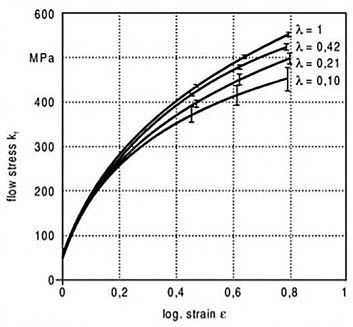
Figure 1: Effect of geometric factor on flow stresses
For example Engel and Eckstein have found that increasing the miniaturization level results in decreasing the flow stress of the material as illustrated in Figure 1. This decrease can be explained according to the fact that the share of the surface grains in micro parts is higher than that of the inner grains as shown in Figure 2. The different mechanisms of dislocation show that the hardening of the inner grain is greater than that of the grains at the surface layers. Hence, the flow stress of materials inversely proportion with the share of surface grains. Another finding here is that increasing grain size and/or miniaturizing level causes an increase in the share of the surface grains. Therefore, one can conclude that the flow stress decreases with increasing the grain size and miniaturizing.
Regarding the micro forming processes of sheet metals such as micro deep drawing, micro stamping, etc., the size effects has significant influence on decisive process parameters. It has been investigated that despite of the same forming conditions are adopted then the friction coefficient in micro scale greater than that at the normal scale. The size effects in micro sheet metal forming can be identified as the following:
- Increasing the surface-to-volume ratio.
- Increasing the influence of adhesion force and surface tension.
- Increasing the influence of grains size on forming micro parts.
- Decreasing the ratio of the closed pockets of lubricant to the lubricating area.
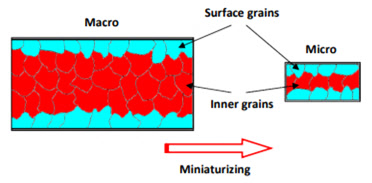
Figure 2: Microstructure of a specimen in both macro and micro scale
Investigations of cylindrical microparts at stainless steel (X4CrNi18-10) produced by cold upsetting reveal that there is a transition in the observed material behavior from homogeneous to inhomogeneous continuum being one of the reasons for a very unstable processes. The forming behavior mainly depends on the part’s individual grain constellation leading to a rather unpredictable forming result and making a process design impossible.
One possibility to counteract the inhomogeneous material character is to process at elevated temperature. During forming at elevated temperature additional slip systems are activated with the effect to reduce the dependency on single grains. This improves not only the material flow but also the reproducibility of process variables like the flow stress.
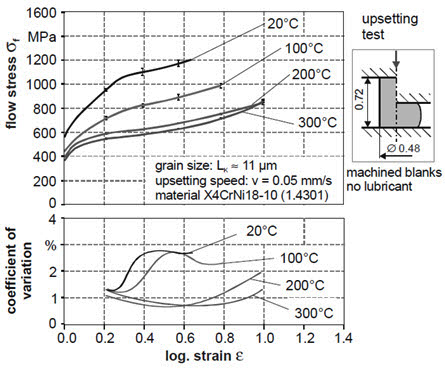
Figure 3: Flow stress and scatter at different temperatures gained by upsetting test
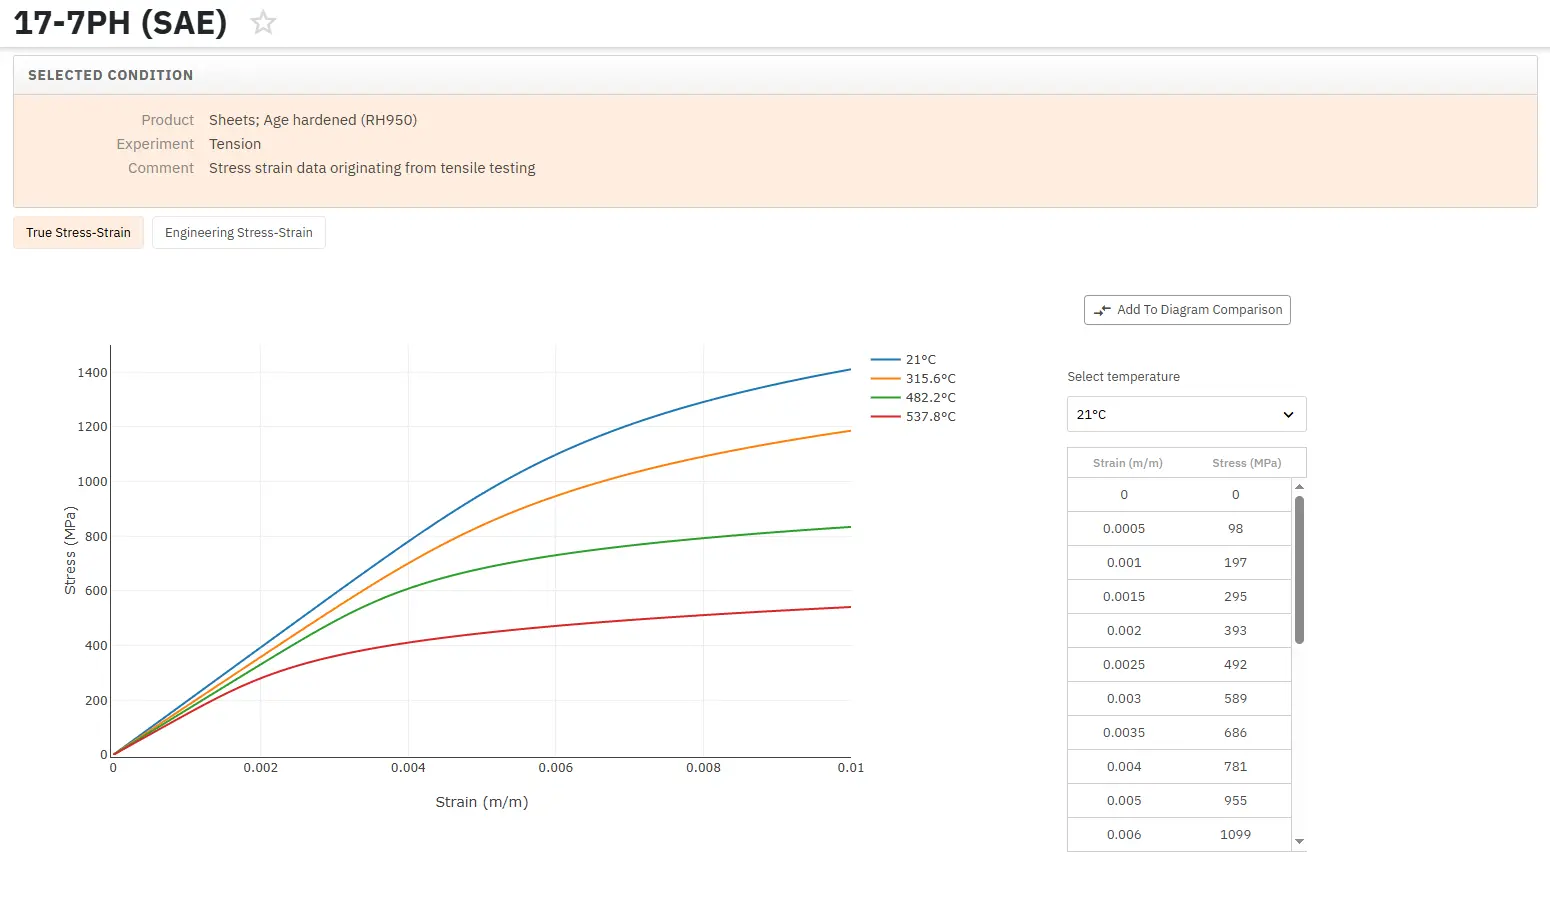
Access Thousands of Stress-Strain Diagrams Now!
Total Materia Horizon includes a unique collection of stress-strain curves of metallic and nonmetallic materials. Both true and engineering stress curves are given, for various strain rates, heat treatments and working temperatures where applicable.
Get a FREE test account at Total Materia Horizon and join a community of over 500,000 users from more than 120 countries.