Linear Elastic Fracture Mechanics (LEFM): Part Two
Abstract
This article examines the three distinct stages of fatigue crack propagation in materials: short crack initiation (Stage I), long crack propagation (Stage II), and final fracture (Stage III). The study details the mechanisms of crack progression, including microstructural influences, striation formation, and fracture surface characteristics. Understanding these stages is crucial for predicting material failure and designing more resilient structures. The article explores how different load conditions affect crack propagation patterns and final fracture characteristics, with particular emphasis on the relationship between applied stress intensity factors and material fracture toughness.
Introduction to Fatigue Crack Propagation
Fatigue crack propagation follows a predictable three-stage progression, each with distinct characteristics and mechanisms. Understanding these stages is fundamental to predicting and preventing material failure in engineering applications.
Stage I: Initial Crack Formation and Growth
In the first stage, fatigue cracks initiate and propagate along high shear stress planes at approximately 45-degree angles
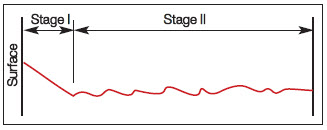
Figure 1: Stage I and II of fatigue crack propagation
Microstructural barriers, such as grain boundaries, inclusions, or pearlitic zones, can impede this initial growth when they cannot accommodate the crack's direction.
Material enhancement techniques, including grain refinement and surface mechanical treatments like shot peening and surface rolling, can increase fatigue strength by introducing additional microstructural barriers. These treatments effectively increase the number of grain boundaries that must be overcome during Stage I propagation.
Stage II: Stable Crack Growth
As the stress intensity factor increases through crack growth or higher applied loads, Stage II begins. Unlike Stage I's 45-degree orientation, cracks in Stage II propagate perpendicular to the load direction.
A distinctive feature of this stage is the formation of surface ripples called "striations," visible under scanning electron microscopy.
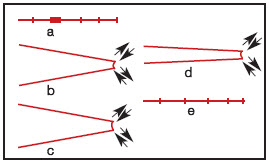
Figure 2: Laird`s proposed mechanisms of striation formation in the stage II of propagation: (a) no load (b) tensile load (c) maximum tensile load (d) load reversion and (e) compressive load
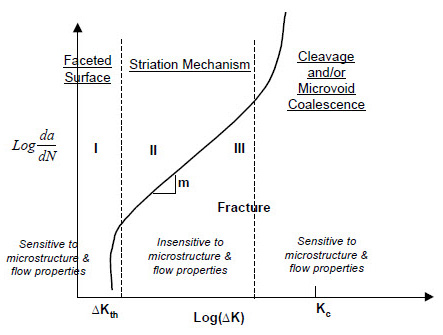
Figure 3: Micro-mechanism of Fatigue
Stage III and Final Fracture Characteristics
The final stage occurs when the maximum stress intensity factor (Kmax) approaches the material's fracture toughness (KIC).
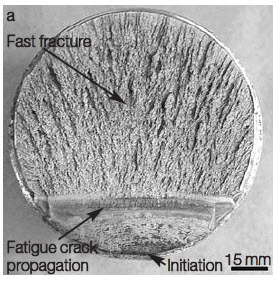
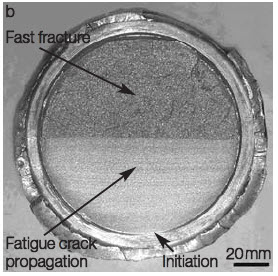
Figure 4: Fatigue fracture surface: (a) high applied load; (b) low applied load
The fracture surface exhibits two distinct regions:
- Lower Region: Characterized by stable crack growth with a smooth appearance due to crack wake face friction. "Beach marks" may appear due to temporary load drops or overload-induced compressive residual stress.
- Upper Region: Displays a fibrous, irregular appearance corresponding to final fracture, which can be either brittle or ductile depending on material properties and loading conditions.
Load Impact on Fracture Patterns
The applied load significantly influences the fracture surface appearance. Higher loads produce smaller stable crack propagation areas (Figure 4a), while lower loads result in extended crack growth periods before reaching the material's fracture toughness, creating smaller fast fracture areas (Figure 4b).
Access Fracture Mechanics Properties of Thousands of Materials Now!
Total Materia Horizon includes a unique collection of fracture mechanics properties such as K1C, KC, crack growth and Paris law parameters, for thousands of metal alloys and heat treatments.
Get a FREE test account at Total Materia Horizon and join a community of over 500,000 users from more than 120 countries.