Engineering Stress-strain Curve: Part Three
Abstract
The engineering tension test is widely used to provide basic design information on the strength of materials and as an acceptance test for the specification of materials. The parameters, which are used to describe the engineering stress-strain curve of a metal, are the tensile strength, yield strength or yield point, percent elongation, and reduction of area.
In the tension test a specimen is subjected to a continually increasing uniaxial tensile force while simultaneous observations are made of the elongation of the specimen. An engineering stress-strain curve is constructed from these measurements, Fig. 1.
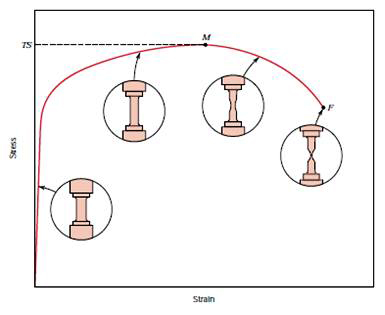
Figure 1: The engineering stress-strain curve
It is obtained by dividing the load by the original area of the cross section of the specimen.
| (1) |
The strain used for the engineering stress-strain curve is the average linear strain, which is obtained by dividing the elongation of the gage length of the specimen, d, by its original length.
| (2) |
Since both the stress and the strain are obtained by dividing the load and elongation by constant factors, the load-elongation curve will have the same shape as the engineering stress-strain curve.
The two curves are frequently used interchangeably.
The general shape of the engineering stress-strain curve (Fig. 1) requires further explanation. In the elastic region stress is linearly proportional to strain. When the load exceeds a value corresponding to the yield strength, the specimen undergoes gross plastic deformation. It is permanently deformed if the load is released to zero. The stress to produce continued plastic deformation increases with increasing plastic strain, i.e., the metal strain-hardens. The volume of the specimen remains constant during plastic deformation, A·L = A0·L0 and as the specimen elongates, it decreases uniformly along the gage length in cross-sectional area.
Initially the strain hardening more than compensates for this decrease in area and the engineering stress (proportional to load P) continues to rise with increasing strain. Eventually a point is reached where the decrease in specimen cross-sectional area is greater than the increase in deformation load arising from strain hardening. This condition will be reached first at some point in the specimen that is slightly weaker than the rest. All further plastic deformation is concentrated in this region, and the specimen begins to neck or thin down locally.
Because the cross-sectional area now is decreasing far more rapidly than strain hardening increases the deformation load, the actual load required to deform the specimen falls off and the engineering stress likewise continues to decrease until fracture occurs.
Tensile Strength
The tensile strength, or ultimate tensile strength (UTS), is the maximum load divided by the original cross-sectional area of the specimen.
| (3) |
The tensile strength is the value most often quoted from the results of a tension test; yet in reality it is a value of little fundamental significance with regard to the strength of a metal. For ductile metals the tensile strength should be regarded as a measure of the maximum load, which a metal can withstand under the very restrictive conditions of uniaxial loading. It will be shown that this value bears little relation to the useful strength of the metal under the more complex conditions of stress, which are usually encountered.
For many years it was customary to base the strength of members on the tensile strength, suitably reduced by a factor of safety. The current trend is to the more rational approach of basing the static design of ductile metals on the yield strength.
However, because of the long practice of using the tensile strength to determine the strength of materials, it has become a very familiar property, and as such it is a very useful identification of a material in the same sense that the chemical composition serves to identify a metal or alloy.
Further, because the tensile strength is easy to determine and is a quite reproducible property, it is useful for the purposes of specifications and for quality control of a product. Extensive empirical correlations between tensile strength and properties such as hardness and fatigue strength are often quite useful. For brittle materials, the tensile strength is a valid criterion for design.
Access Thousands of Stress-Strain Diagrams Now!
Total Materia Horizon includes a unique collection of stress-strain curves of metallic and nonmetallic materials. Both true and engineering stress curves are given, for various strain rates, heat treatments and working temperatures where applicable.
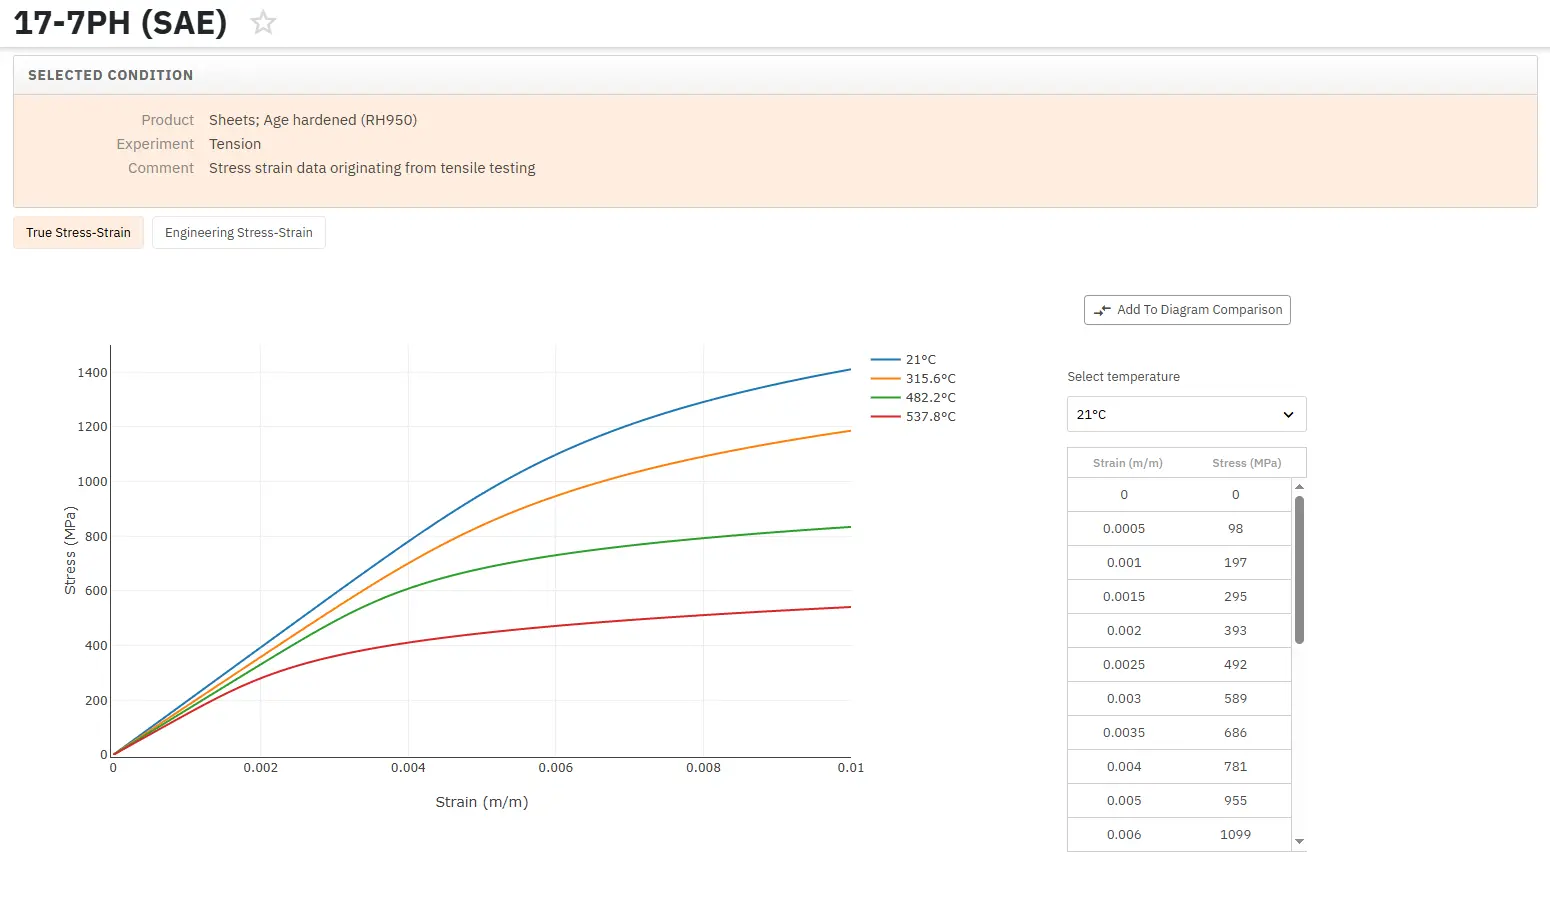
Get a FREE test account at Total Materia Horizon and join a community of over 500,000 users from more than 120 countries.