True Stress - True Strain Curve: Part One
Abstract
This article examines the relationship between stress and strain in materials testing, focusing on the interpretation of stress-strain curves and their significance in materials science. It details the key points along a typical stress-strain curve, from elastic deformation through plastic deformation to ultimate failure, and explains the transition from engineering to true stress-strain measurements. The analysis includes the mathematical foundations for calculating true stress and strain, providing engineers and materials scientists with essential insights into material behavior under loading conditions.
Introduction to Stress-Strain Analysis
During materials testing, the stress-strain curve serves as a fundamental tool for understanding material behavior under loading conditions. This graphical representation illustrates the relationship between applied stress (calculated from the load) and resulting strain (derived from deformation measurements). The curve's characteristics vary significantly among different materials, providing crucial information about their mechanical properties.
Figure 1: Typical stress-strain curve showing key transition points
Key Points Along the Stress-Strain Curve
1. Initial Response and Elastic Region (Point A)
The curve begins at the origin, where neither stress nor strain is present. Up to Point A, materials follow Hooke's Law, exhibiting linear proportionality between stress and strain. This point, known as the proportional limit, marks the boundary of purely elastic behavior, where materials can fully recover their original shape upon load removal.
2. Yield Point and Elastic Limit (Point B)
Between Points A and B, the relationship becomes non-linear, with strain increasing more rapidly than stress. Point B represents the elastic limit or yield point, beyond which permanent deformation occurs.
3. Plastic Deformation Region (Points C and D)
After Point B, the material enters the plastic deformation stage, continuing until Point C. At this stage, the cross-sectional area begins to decrease, leading to a stress reduction toward Point D. Between Points D and E, the material experiences significant length changes with minimal stress increase.
4. Ultimate Stress and Failure (Points E and F)
Point E marks the ultimate stress value, followed by a region of material strengthening requiring increased stress for further deformation. The material ultimately fails at Point F, known as the fracture point.
Construction of True Stress-Strain Diagrams
The development of an accurate true stress-strain diagram depends on several critical measurement conditions and assumptions. A true stress-strain diagram can be constructed when the instantaneous minimal cross-sectional area can be measured during testing, along with the applied load (P) and length (L). Additionally, the constant-volume deformation assumption must remain valid during plastic deformation.
Mathematical Framework
For true strain calculation, two primary equations serve different regions of deformation. In the elastic and initial plastic regions, true strain is calculated using the equation ε = log (L/L0), where L represents the current length and L0 represents the initial length. Once significant plastic deformation begins, the equation ε = log (A0/A) becomes applicable, where A0 represents the initial cross-sectional area, and A represents the current cross-sectional area.
In practical applications, engineers typically employ the equation ε = log (A0/A) across the entire strain range, as the resulting error is generally negligible. Throughout the entire test, the true stress equation remains consistent as σ = P/A, where P represents the applied load, and A represents the current cross-sectional area.
Figure 2: Material properties determined from stress-strain diagrams: (a) Engineering stress-strain diagram; (b) determination σ by the offset method; (c) true stress-strain diagram
Limitations and Considerations
The construction of accurate true stress-strain diagrams faces two significant limitations. First, when plastic deformation occurs at non-constant volume, the accuracy of the diagrams becomes considerably compromised. Second, both true and engineering stress-strain diagrams fail to account for the multiaxial stress states present in necked regions. This multiaxial stress limitation, while important, is typically accepted in practical applications due to the complexity of incorporating these effects into the analysis.
Engineers and researchers generally acknowledge this limitation while recognizing that the resulting diagrams still provide valuable material behavior insights. This approach to stress-strain analysis, despite its limitations, remains a fundamental tool in materials science and engineering, offering crucial insights into material behavior under loading conditions. The mathematical framework provides a practical means of quantifying material response, while the acknowledged limitations help ensure appropriate application of the resulting data.
Access Thousands of Stress-Strain Diagrams Now!
Total Materia Horizon includes a unique collection of stress-strain curves of metallic and nonmetallic materials. Both true and engineering stress curves are given, for various strain rates, heat treatments and working temperatures where applicable.
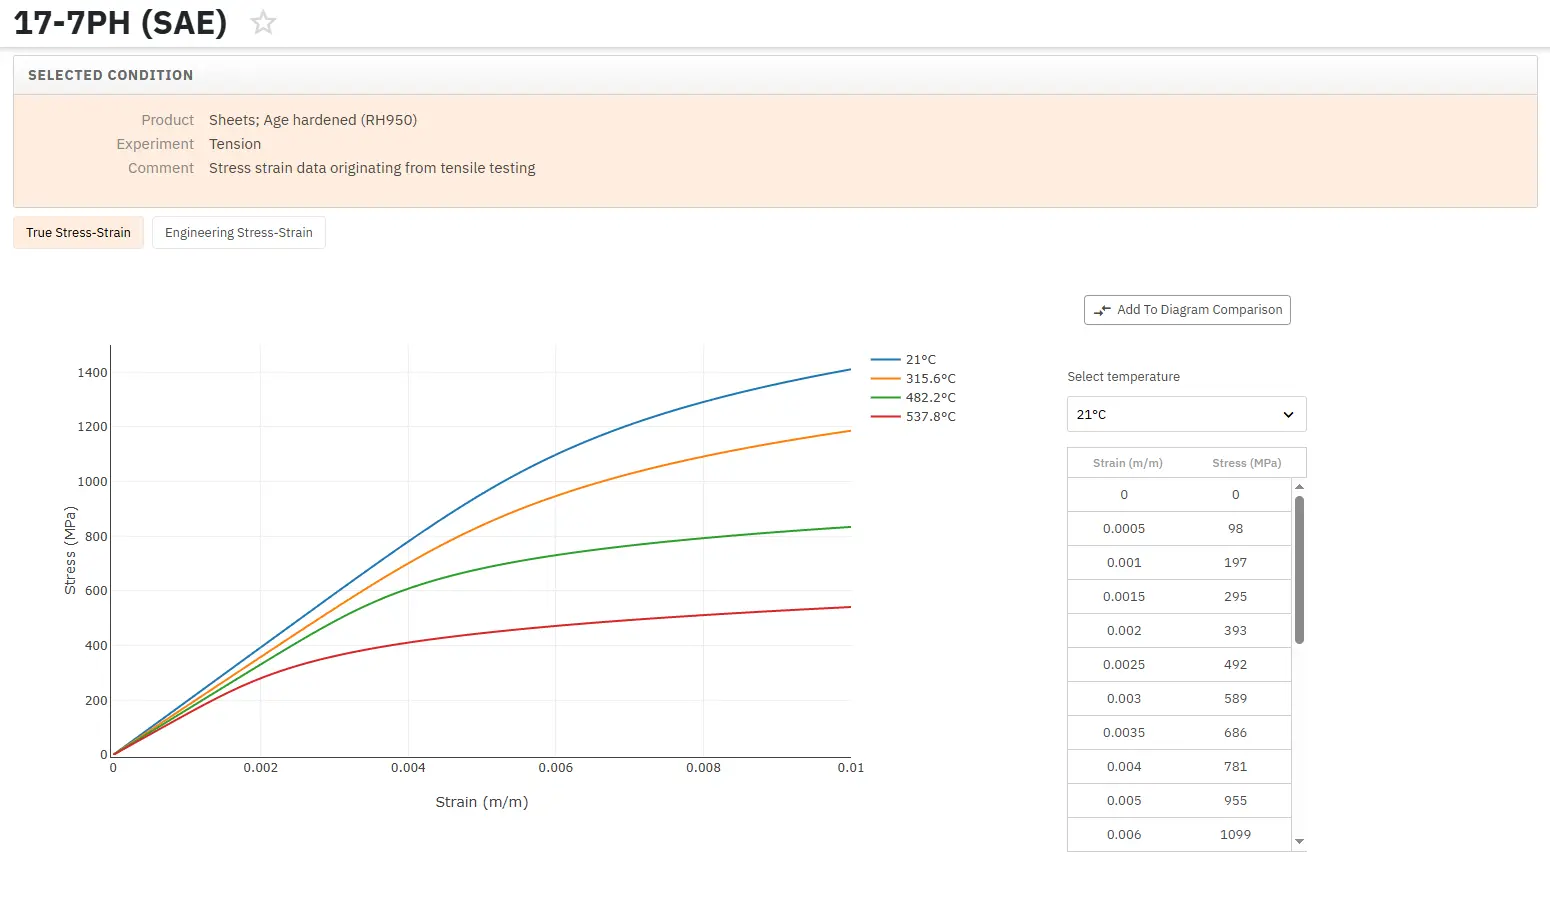
Get a FREE test account at Total Materia Horizon and join a community of over 500,000 users from more than 120 countries.