Residual Welding Stress
Welding is one of the most important technological processes used across numerous branches of industry such as industrial engineering, shipbuilding, pipeline fabrication to name but a few.
Diffraction methods for measuring residual stress can be used to determine non-destructively the stress state inside a sample, by measuring changes in lattice spacing from the ‘unstressed’ state.
Welding is one of the most important technological processes and is used across numerous branches of industry such as industrial engineering, shipbuilding, pipeline fabrication to name but a few. Residual stresses arising after welding exert a considerable influence on the service characteristics of welded equipment, and their control allows avoiding failure of welded joint.
The influence of residual stresses on service characteristics of welded equipment is analysed in many original papers and books. Different techniques are used to control the stress state in the weld region. X-ray diffraction technique is one of the methods widely used to analyse residual stress distribution in the weld seam and near the welded region. However, numerous measurements by X-ray tensometry contain contradictory information about weld-induced residual stresses and the analysis of stress distribution is usually carried out without consideration of equilibrium conditions.
Two types of sample were used to study the residual stress distribution in the weld region. One of them was made from A106GrB steel plates joined by arc welding with linear weld seam (see figure 1a). Its dimensions are 45cm x 30cm x 13mm.
The other type of sample (SAE1020 steel) is a disk shaped plate with a circular weld seam. Two of these samples were made with dimensions 250mm and 150mm in diameter and 25 mm of thickness. Figure 1 shows the structures of the weld seams and indicates the points of stress measurements located in the seam, heat-affected zone and outside the weld region.
At each point two stress components were measured; one of them is perpendicular to the weld seam (transverse residual stress or radial for disk shaped sample) and the other is parallel (longitudinal residual stress or tangential for disk shaped sample).
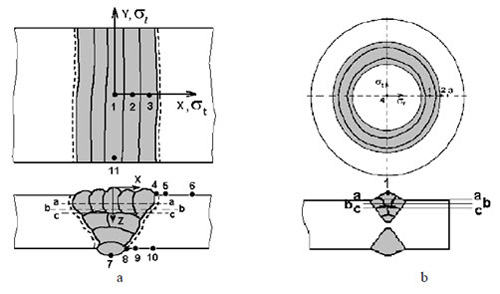
Figure 1: Scheme of the weld seam structure and points of stress measurements: (a-a), (b-b), (c-c) positions of stress measurements after layer removals
In the work of Noel P. O’Dowd et al. the stress distributions have been measured using the neutron diffraction method, which determines the stress field directly from the measured elastic strains. A high strength steel (designated SE 702, equivalent to the A517 Grade Q steel) and a medium strength steel (BS EN 10025 Grade S355) have been examined. The former has yield strength of 700 MPa and the latter has yield strength of 360 MPa.
It has been found that the transverse residual stress distribution for different plate sizes and yield strength are of similar shape and magnitude when normalized appropriately and peak stresses are on the order of the material yield strength. The measured stresses are compared with the distributions provided in UK safety assessment procedures and the conservatism in the existing stress distributions is assessed.
The linear elastic stress intensity factors arising from the residual stress distributions have also been determined using the finite element method and the results compared with those obtained from the stress distributions in the assessment procedures.
It is found that the K values obtained using the recommended stress distributions are significantly conservative. The conservatism is reduced somewhat if a residual stress distribution recently proposed for welded T-plates is used. The K values for the T-plate have been compared with those obtained if the weld attachment is ignored and the T-plate treated as a smooth edge cracked plate. It is found that except for shallow cracks (a=W • 0:1) the difference between the two K values is negligible.
The Neutron Diffraction Method
Diffraction methods for measuring residual stress can be used to determine non-destructively the stress state inside a sample, by measuring changes in lattice spacing from the ‘unstressed’ state. Neutrons have a penetration depth of several cm in most metals allowing the stress state deep inside a sample to be determined.
When illuminated by radiation of wavelength, l, similar to the lattice spacing, crystalline materials diffract the radiation as distinctive Bragg peaks. If the angle, q, at which a peak occurs, is measured, Bragg’s law can be used to determine the lattice spacing, d,
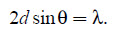 ... (1)
If the un-stressed lattice spacing and diffraction angle, are do and θo respectively, then the elastic strain, ε can be determined by the differentiated form of Equation 1, i.e.
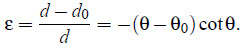 ... (2)
The stress, σ, may then be obtained from the linear elastic properties of the material and the measured elastic strain, ε, in the relevant directions.
For this work the neutron diffraction measurements were obtained on the instrument, REST, at the reactor source at Studsvik, Sweden. The instrument uses a monochromator which produces a single wavelength neutron beam from the polychromatic beam emerging from the reactor.
In order to obtain three mutually perpendicular stress components (transverse, longitudinal and normal stress) measurements were carried out with the specimen orientated as in Figure 1 (for the longitudinal and transverse elastic strain) and rotated through 90°± in the plane of Figure 1 (for the normal elastic strain).
Reference measurements were made in the parent material at an extremity of the sample to obtain the reference diffraction angle, θo for the unstressed material. The strain at a point is then measured relative to this ‘strain-free’ angle using Equation 2. The three stress components are obtained from the three normal strain components using Hooke’s law.
For a given neutron flux and diffractometer design the time taken for a residual stress measurement is controlled by the distance travelled by the neutrons to enter and exit the steel (the neutron path length) and the properties of the material being measured.
In order to reduce the neutron path length, relatively thin slices of the welds have been measured (13.5 mm). It has been shown in the work of Wimpory, R., et al. by comparison with hole drilling measurements on a full thickness T-plate that, although such slicing reduces the out of plane (longitudinal stress), it does not have a significant effect on the in-plane (normal and transverse) stresses.
A 2x2x2 mm3 sampling volume was used and measurements were made at 28 locations across the specimen width. The 211 Bragg reflection was chosen using a wavelength of 1.7A°. This yielded a reflection at approximately 2θ = 93.5°C. The total measurement time was approximately 72 hours (24 hours for each direction).
It is been shown that the residual stress distributions provided in existing structural assessment procedures can be very conservative, leading to an overestimate of the stress intensity factor of at least 50%. For the medium strength steel, which has a high toughness (KJIC ~ 240 MPa m1 this is perhaps not of great significance since the K value due to residual stress is considerably less than the material toughness (for a/W = 0.1, the K value for a 50 mm plate with σy = 360 MPa is approx. 30 MPa m1).
However, the fracture toughness of the SE702 material is considerably lower - KIC the toughness lies between 100 and 150 MPa m1. Thus the K value due to the weld residual stress is a significant fraction of the fracture toughness of the material. This issue is addressed in Figure 2 where the K values obtained from the R6 and BS7910 distributions are compared to those obtained from the measured distribution.
It is seen that the K value from the R6 and BS7910 distributions, even for the most shallow crack, is close to the measured fracture toughness of the material and would thus lead to a very non-conservative assessment. Fracture testing of the SE702 steel is ongoing, both to confirm the toughness values and to examine failure loads in T-plates containing residual stress.
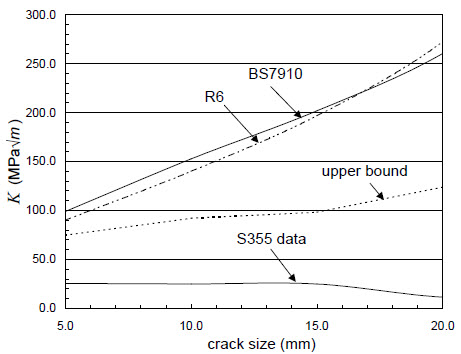
Figure 2: Comparison of actual K values for the SE702 T-Plate with the representative distributions