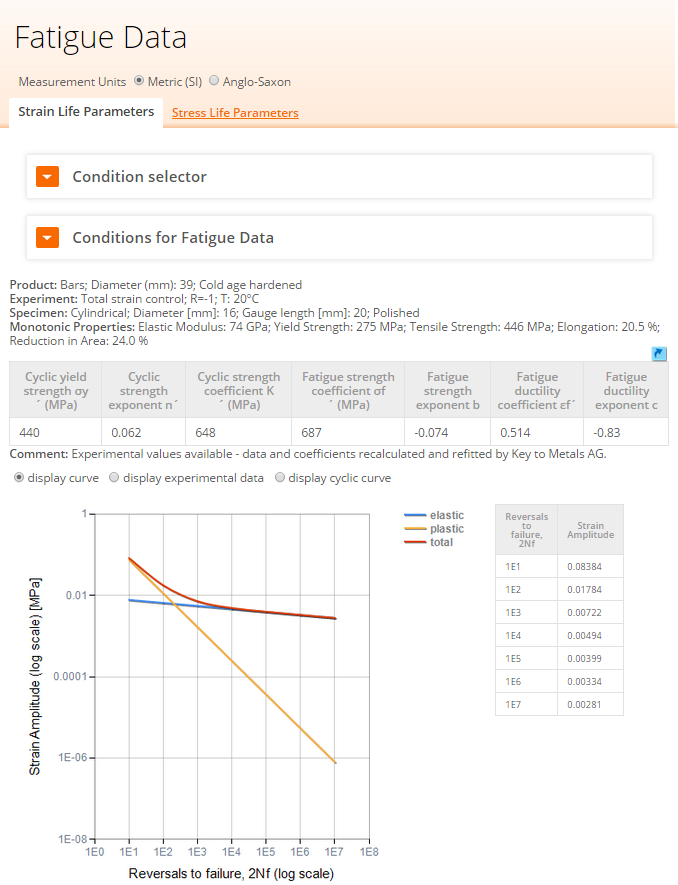
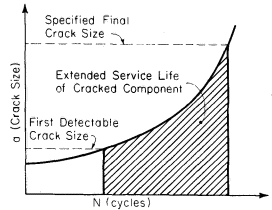
The aircraft industry has leaded the effort to understand and predict fatigue crack growth. They have developed the safe-life or fail-safe design approach. In this method, a component is designed in a way that if a crack forms, it will not grow to a critical size between specified inspection intervals. Thus, by knowing the material growth rate characteristics and with regular inspections, a cracked component may be kept in service for an extended useful life. This concept is shown schematically in Fig. 1.
Fatigue Crack Growth Curves
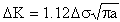
Typical constant amplitude crack propagation data are shown in Fig. 2. The crack length, a, is plotted versus the corresponding number of cycles, N, at which the crack was measured.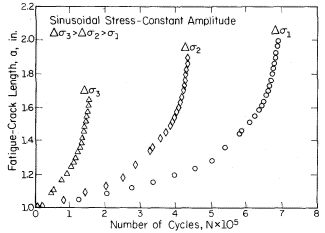
As shown, most of the life of the component is spent while the crack length is relatively small. In addition, the crack growth rate increases with increased applied stress.
The crack growth rate, da/dN, is obtained by taking the derivative of the above crack length, a, versus cycles, N, curve. Two generally accepted numerical approaches for obtaining this derivative are the spline fitting method and the incremental polynomial method. These methods are explained in detail in many numerical methods textbooks. Values of log da/dN can then be plotted versus log DK, for a given crack length, using the equation
|
(1) |
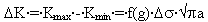
where Ds is the remote stress applied to the component as shown in Fig. 3.
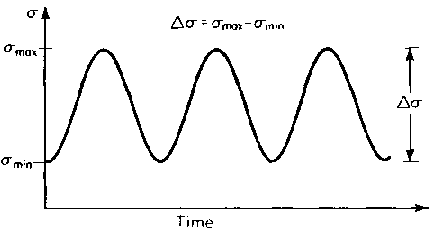
A plot of log da/dN versus log DK, a sigmoidal curve, is shown in Fig. 4. This curve may be divided into three regions. At low stress intensities, Region I, cracking behavior is associated with threshold, DKth, effects. In the mid-region, Region II, the curve is essentially linear. Many structures operate in this region. Finally, in the Region III, at high DK values, crack growth rates are extremely high and little fatigue life is involved.
Region II
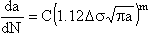
Most of the current applications of LEFM concepts to describe crack growth behavior are associated with Region II. In this region the slope of the log da/dN versus log DK curve is approximately linear and lies roughly between 10-6 and 10-3 in/cycle. Many curve fits to this region have been suggested. The Paris equation, which was proposed in the early 1960s, is the most widely accepted. In this equation

|
(2) |
where C and m are material constants and DK is the stress intensity range Kmax - Kmin.
Values of the exponent, m, are usually between 3 and 4. These range from 2,3 to 6,7 with a sample average of m = 3,5. In addition, tests may be performed. ASTM E647 sets guidelines for these tests.
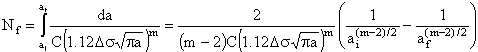
The crack growth life, in terms of cycles to failure, may be calculated using Eq. (2). The relation may be generally described by

|
Thus, cycles to failure, Nf, may be calculated as

|
(3) |
where ai is the initial crack length and af is the final (critical) crack length. Using the Paris formulation,

|
(4) |
|
Because DK is a function of the crack length and a correction factor that is dependent on crack length [see Eq. (1)], the integration above must often be solved numerically. As a first approximation, the correction factor can be calculated at the initial crack length and Eq. (4) can be evaluated in closed form.
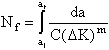
As an example of closed form integration, fatigue life calculations for a small edge-crack in a large plate are performed below. In this case the correction factor, f(g) does not vary with crack length. The stress intensity factor range is
|
(5) |
Substituting into the Paris equation yields
|
(6) |
Separating variables and integrating (for m<>2) gives
|
(7) |
Before this equation may be solved, the final crack size, af, must be evaluated. This may be done using as follows:

|
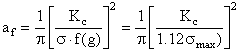
|
(8) |
For more complicated formulations of DK, where the correction factor varies with the crack length, a, iterative procedures may be required to solve for af in Eq. (8).
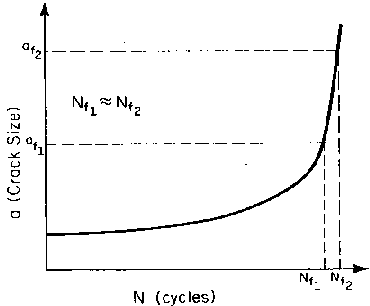
It is important to note that the fatigue-life estimation is strongly dependent on ai, and generally not sensitive to af (when ai«af). Large changes in af result in small changes of Nf as shown schematically in Fig. 5.